Deliverables
Interactive dashboard, sales analysis, responsive data visualization
Interactive dashboard, sales analysis, responsive data visualization
Role
Data Visualization Designer & Analyst
Data Visualization Designer & Analyst
BUSINESS QUESTION
“How should Northstar Goods allocate its $2,500 fall marketing budget to increase net sales while avoiding channels, offers, or customer groups with high return rates?”
DATA & APPROACH
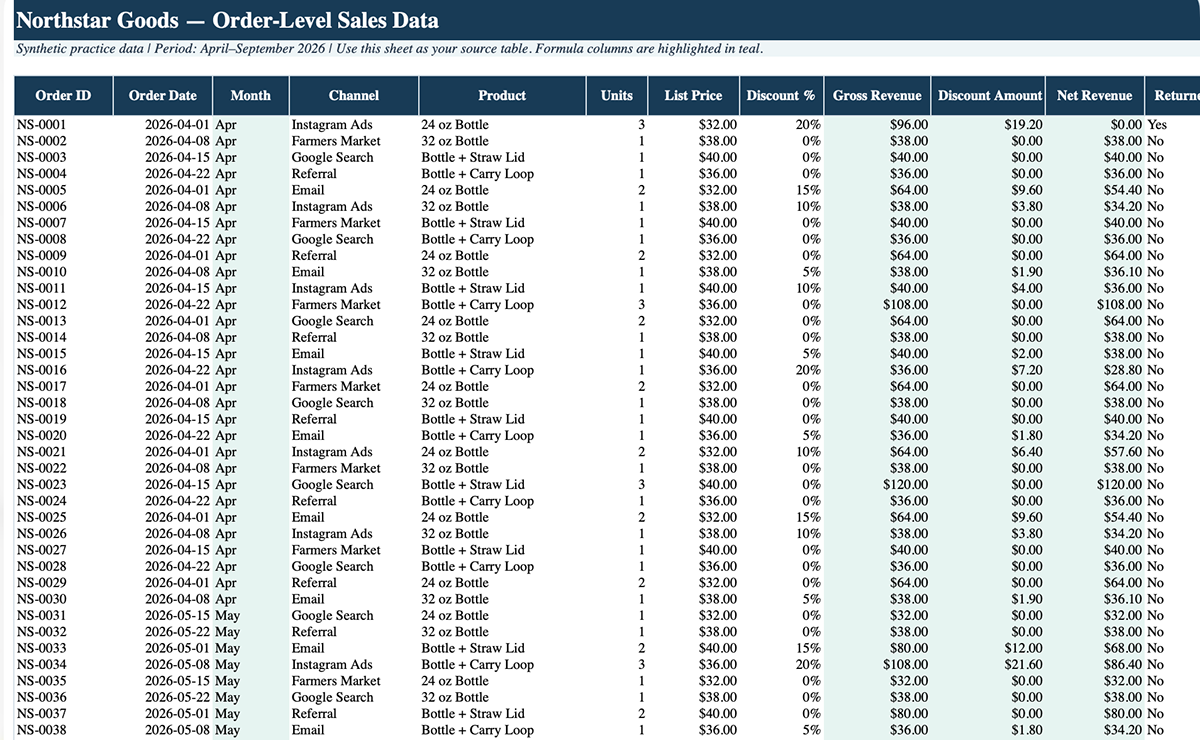
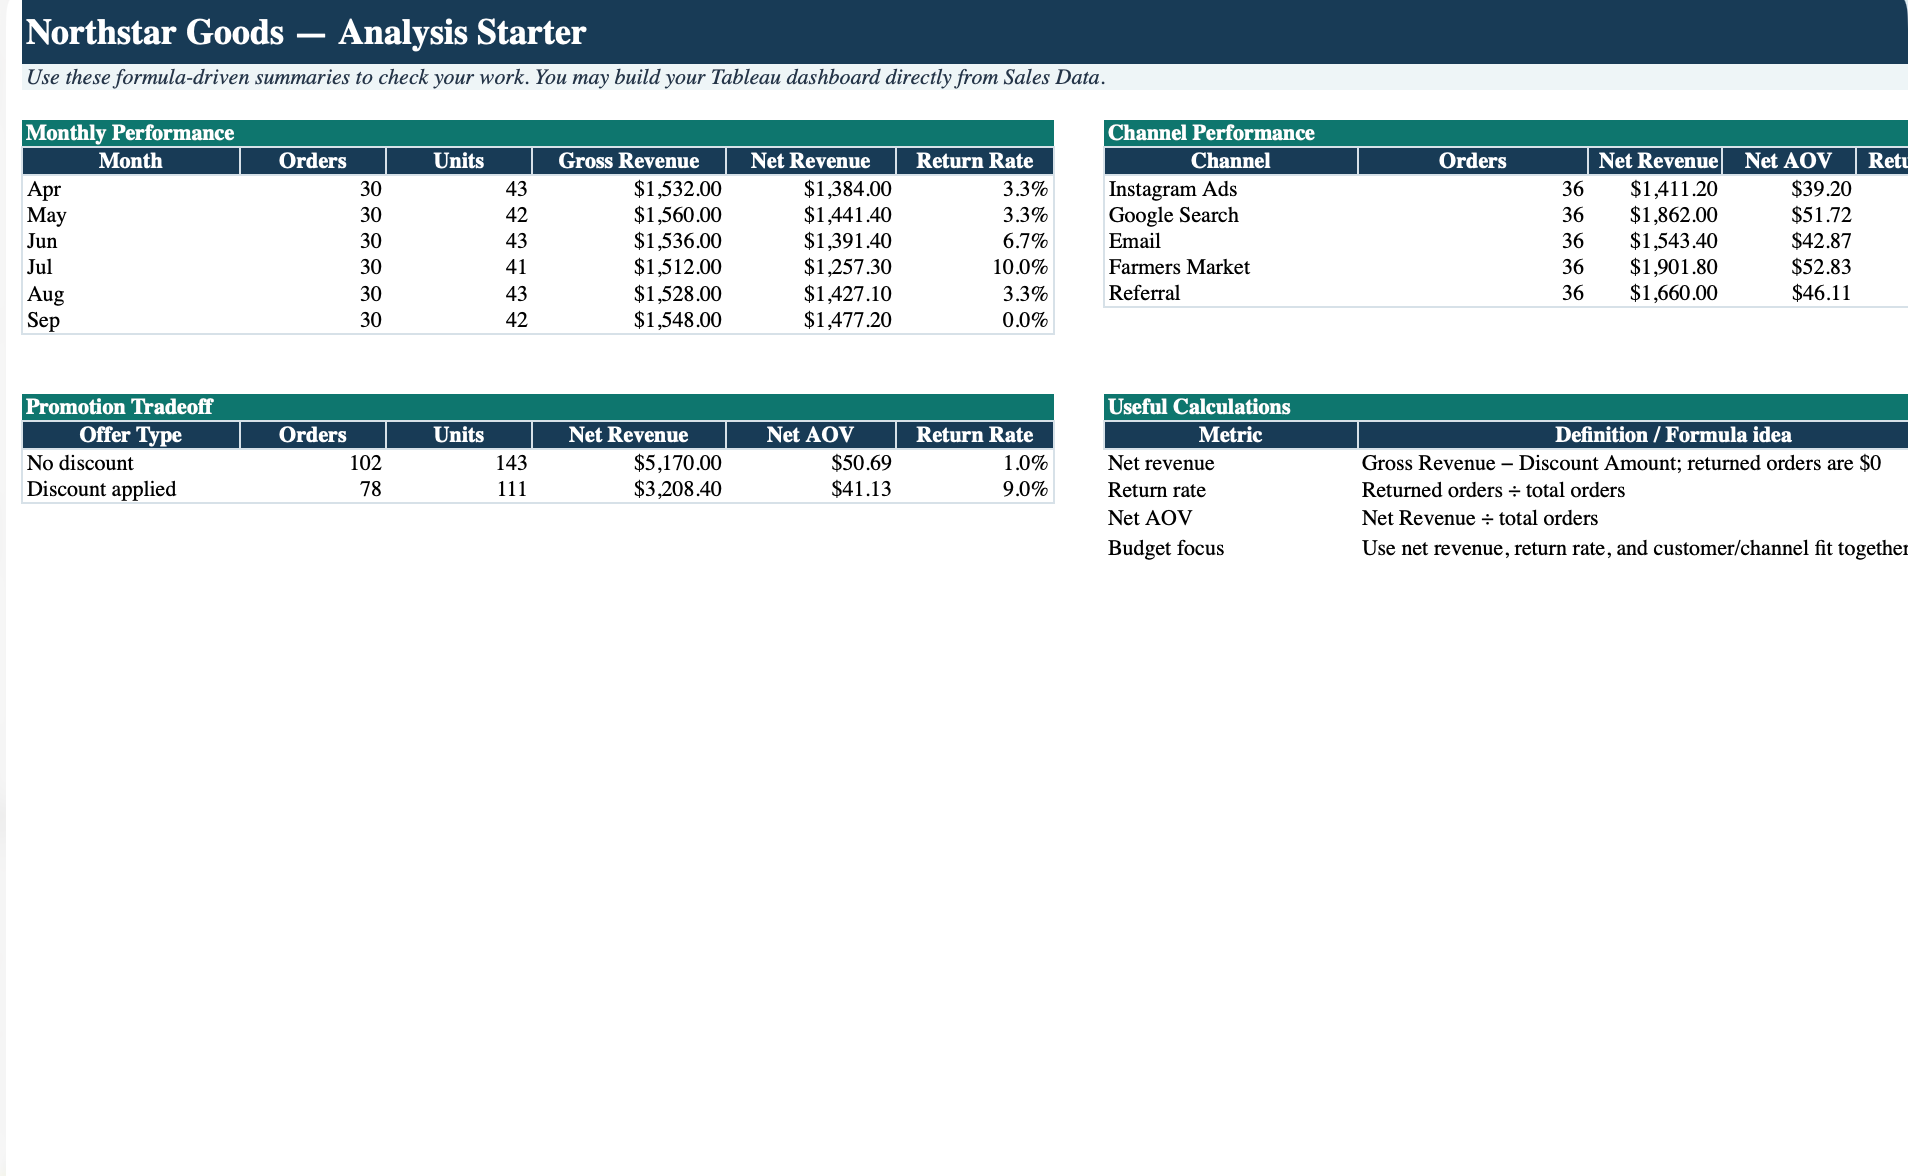
180 synthetic sales records, April–September 2026, cleaned/prepared in Excel and analyzed in Tableau. Measures included net revenue, AOV, units/order, and return rate; dimensions included channel, product, age group, customer type, region, and offer type.
INTERACTIVE DASHBOARD
Key FINDINGS
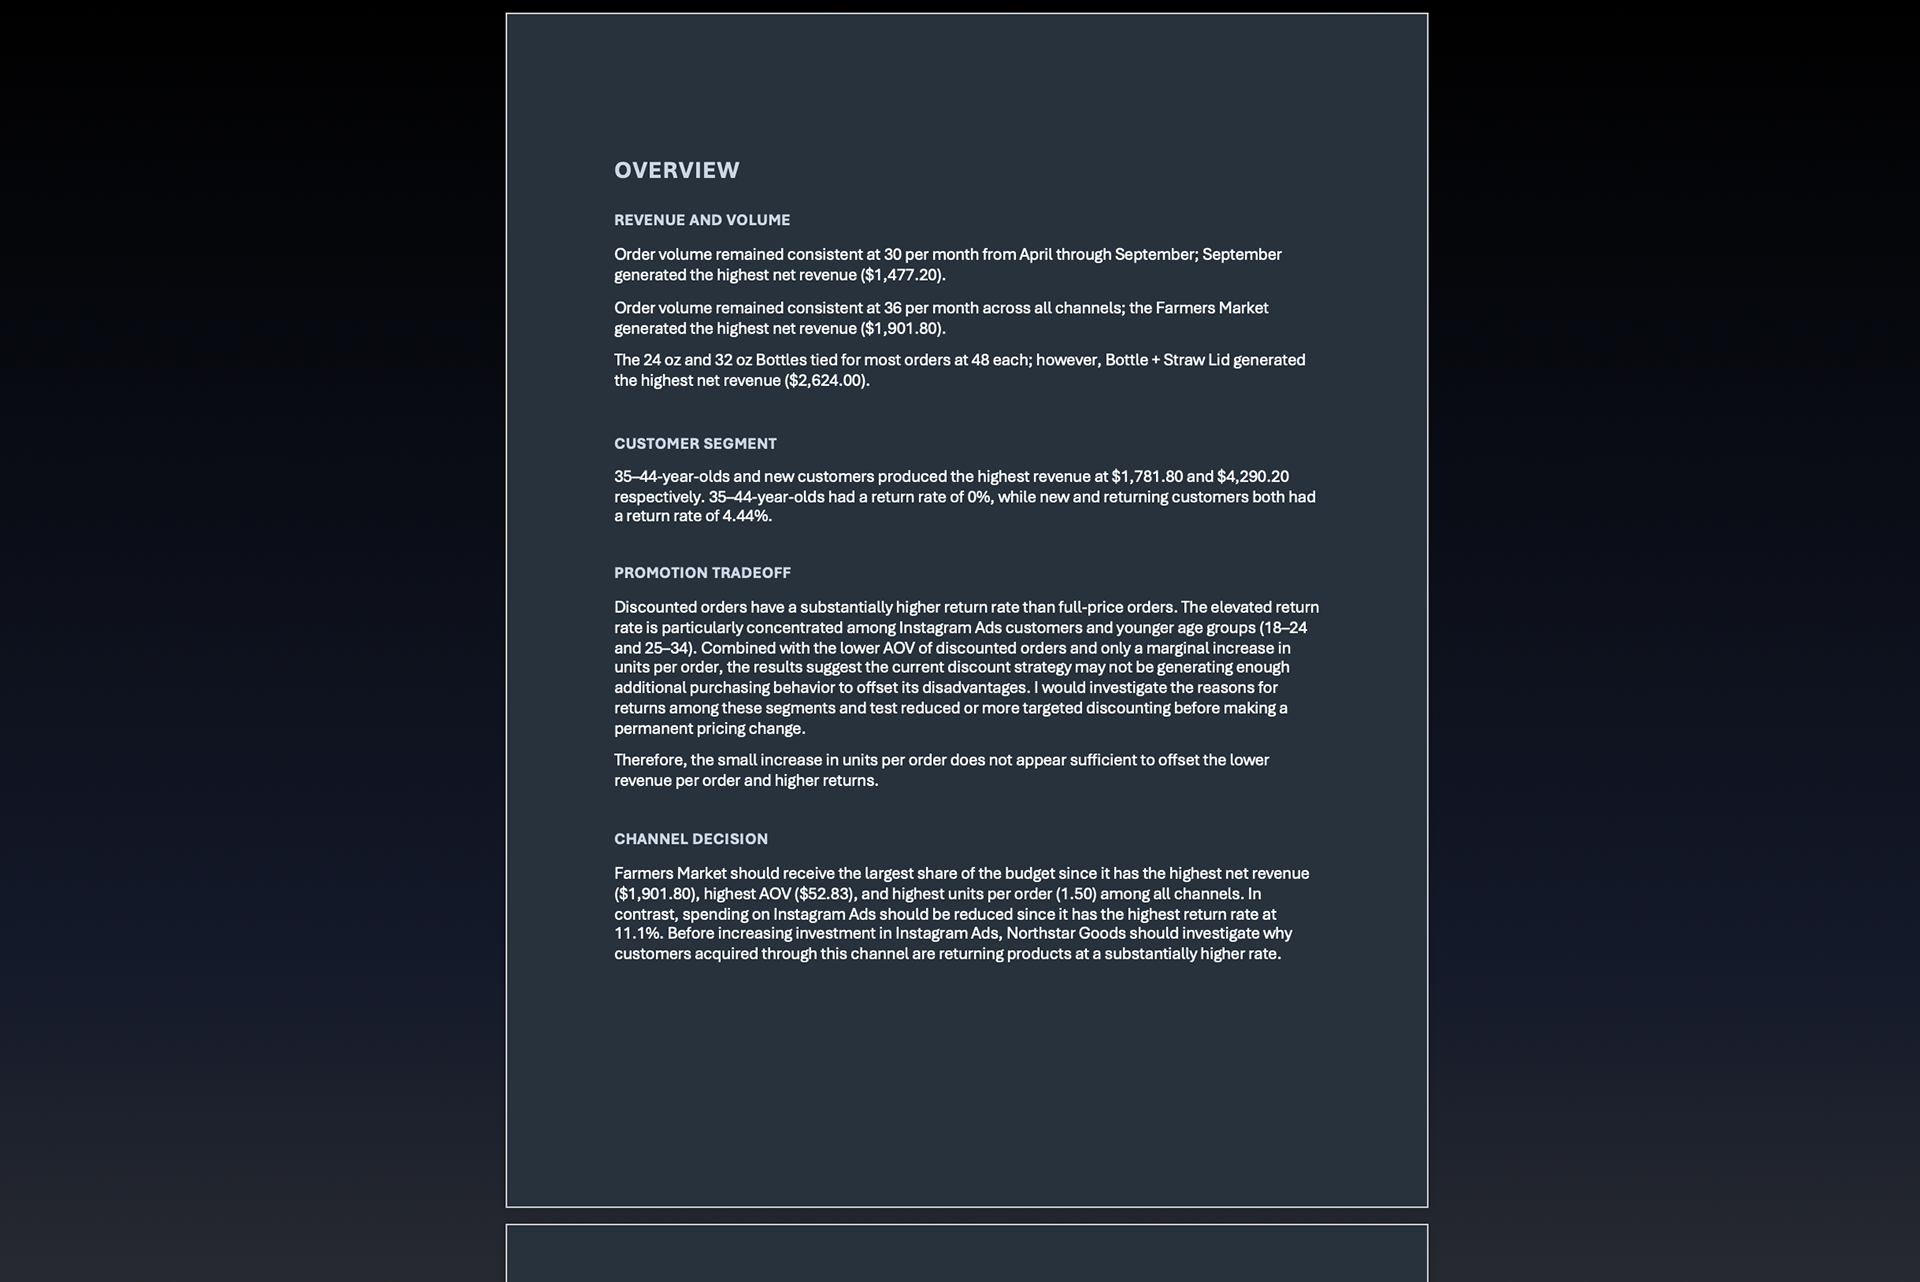
Farmers Market led channels at $1,901.80 net revenue, $52.83 AOV, and 1.50 units/order, while Instagram Ads had the highest return rate at 11.1%.
RECOMMENDATIONS – Based on APRIl–September performance
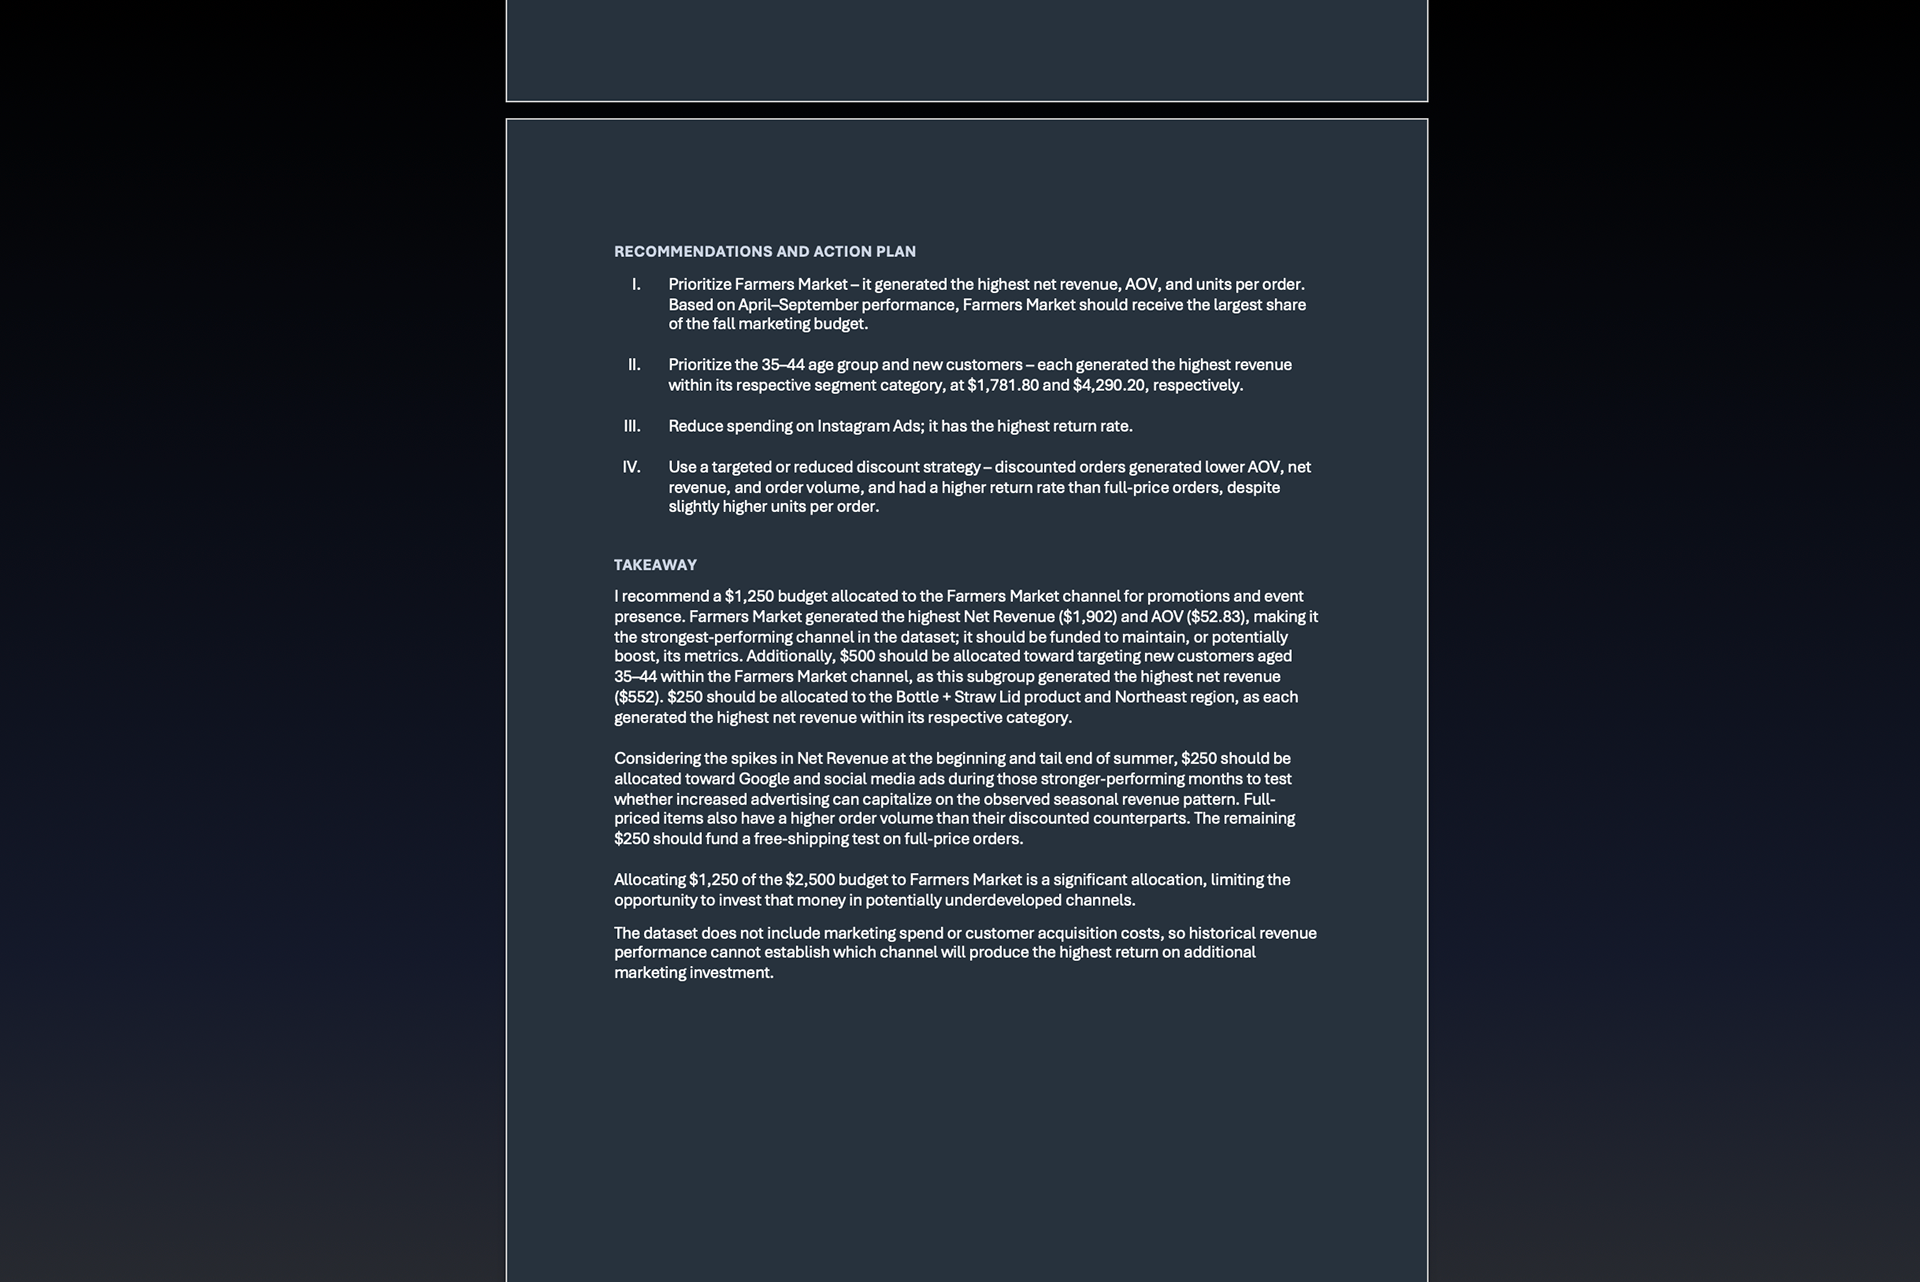
I. Prioritize Farmers Market – it generated the highest net revenue, AOV, and units per order. Based on April–September performance, Farmers Market should receive the largest share of the fall marketing budget.
II. Prioritize the 35–44 age group and new customers – each generated the highest revenue within its respective segment category, at $1,781.80 and $4,290.20, respectively.
III. Reduce spending on Instagram Ads; it has the highest return rate.
IV. Use a targeted or reduced discount strategy – discounted orders generated lower AOV, net revenue, and order volume, and had a higher return rate than full-price orders, despite slightly higher units per order.
Budget Allocation
$1,250 — Farmers Market Promotions and Event Presence
Support the channel with the highest net revenue ($1,902), average order value ($52.83), and units per order (1.50).
Support the channel with the highest net revenue ($1,902), average order value ($52.83), and units per order (1.50).
$500 — New Customers Aged 35–44 (Farmers Market)
Target new customers aged 35–44 through the Farmers Market channel. This combined subgroup generated $552 in net revenue.
Target new customers aged 35–44 through the Farmers Market channel. This combined subgroup generated $552 in net revenue.
$250 — Bottle + Straw Lid Promotion in the Northeast
Promote the highest-net-revenue product within the strongest-performing region.
Promote the highest-net-revenue product within the strongest-performing region.
$250 — Seasonal Digital Advertising Test
Test Google Search and social advertising during the stronger-performing months observed at the beginning and end of summer.
Test Google Search and social advertising during the stronger-performing months observed at the beginning and end of summer.
$250 — Free-Shipping Experiment
Test free shipping on full-price orders as an alternative to discounting, which was associated with lower AOV and a higher return rate.
Test free shipping on full-price orders as an alternative to discounting, which was associated with lower AOV and a higher return rate.
Total Budget — $2,500
LIMITATIONS
Allocating $1,750 of the $2,500 budget to Farmers Market is a significant allocation, limiting the opportunity to invest that money in potentially underdeveloped channels.
Because the dataset does not include marketing costs or customer acquisition costs, historical revenue cannot determine which channel will generate the highest return on additional investment.
Process / Technical Implementation
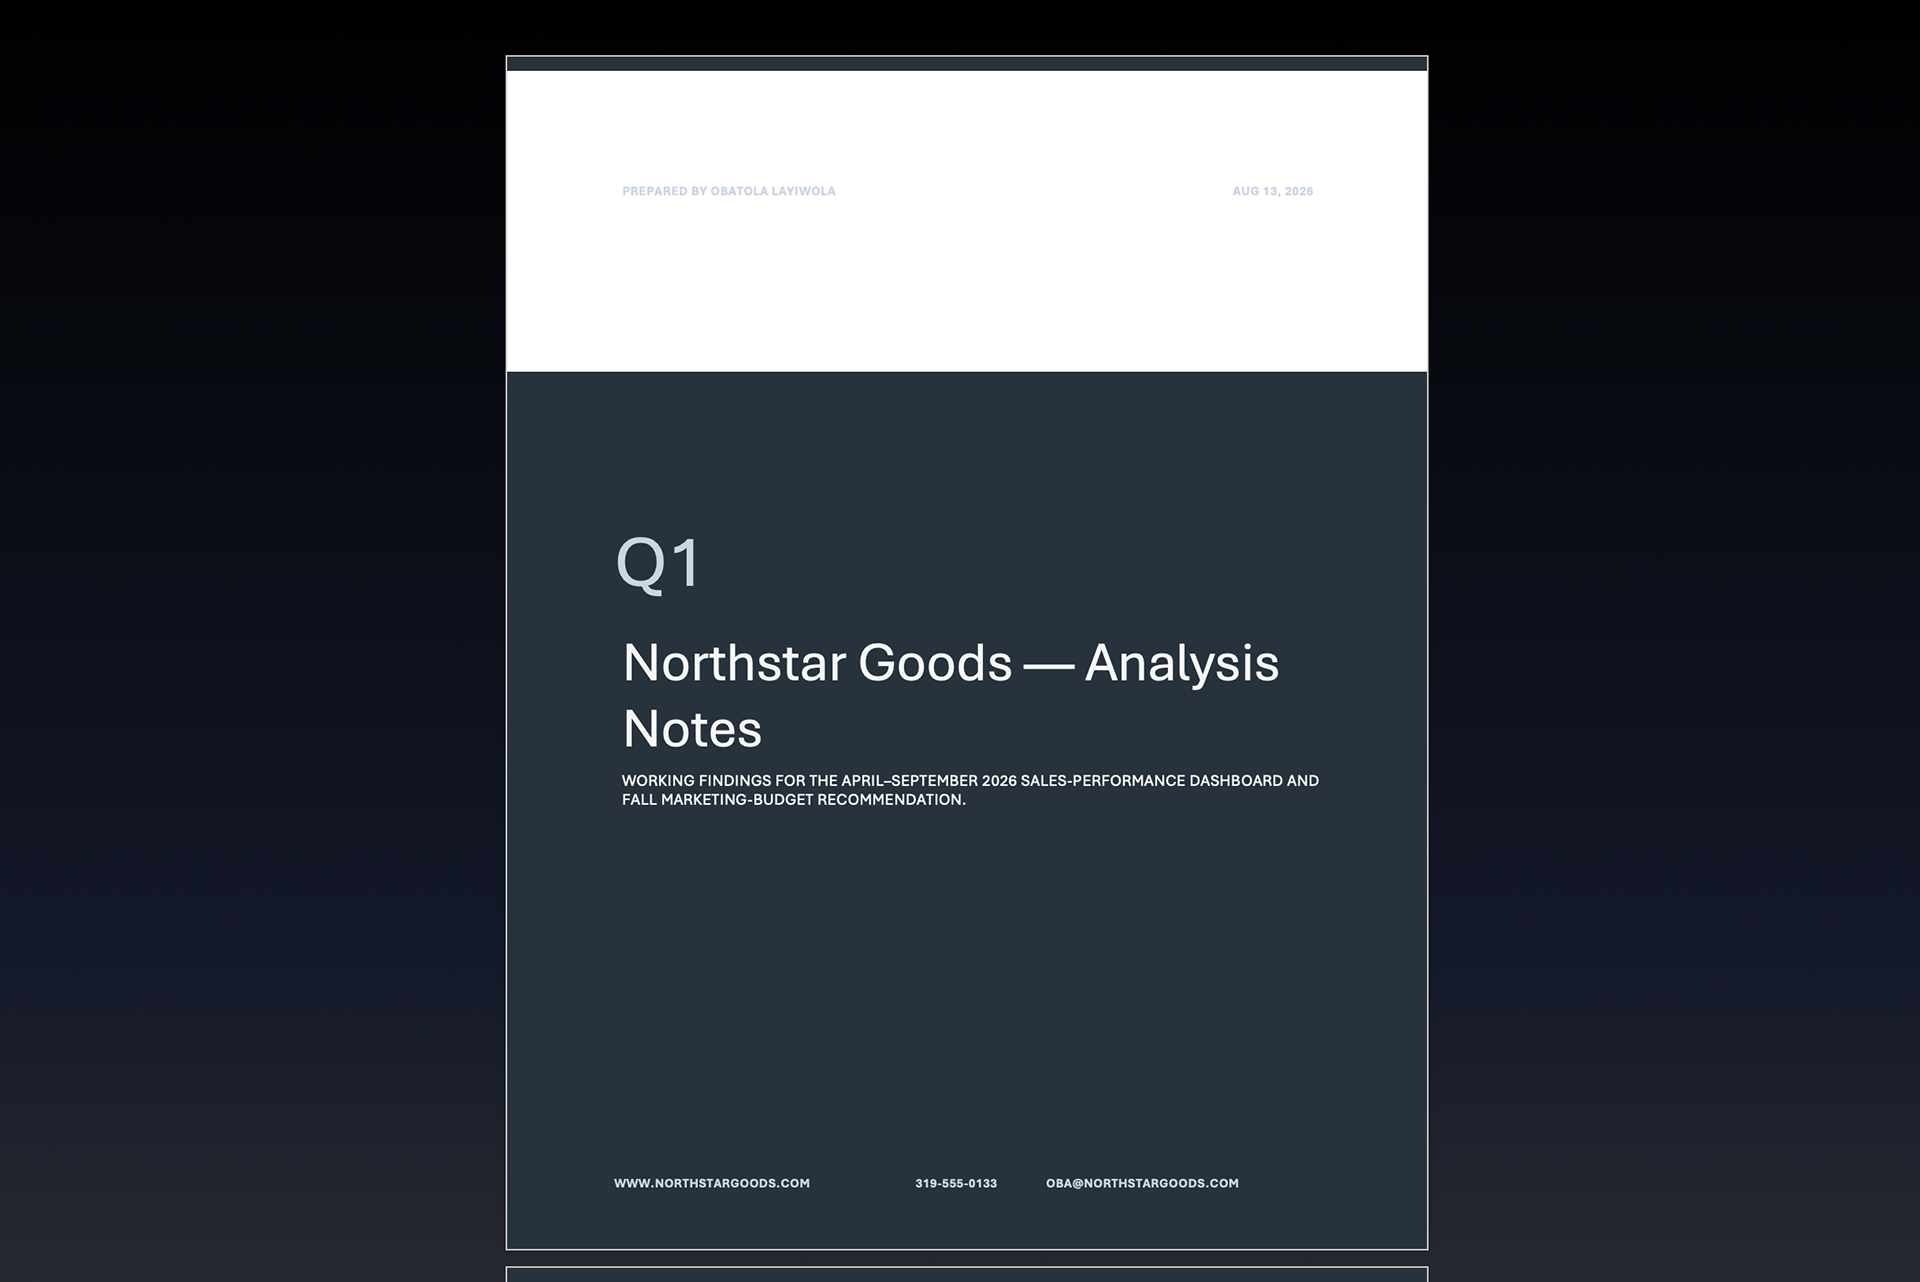
Excel → calculated fields → parameters → dynamic Tableau views → desktop/mobile layouts → publishing.